
3. Explore the data
Browse tables, filter rows and follow links between records.
3 · Explore the data lets you check the generated data before you download it.
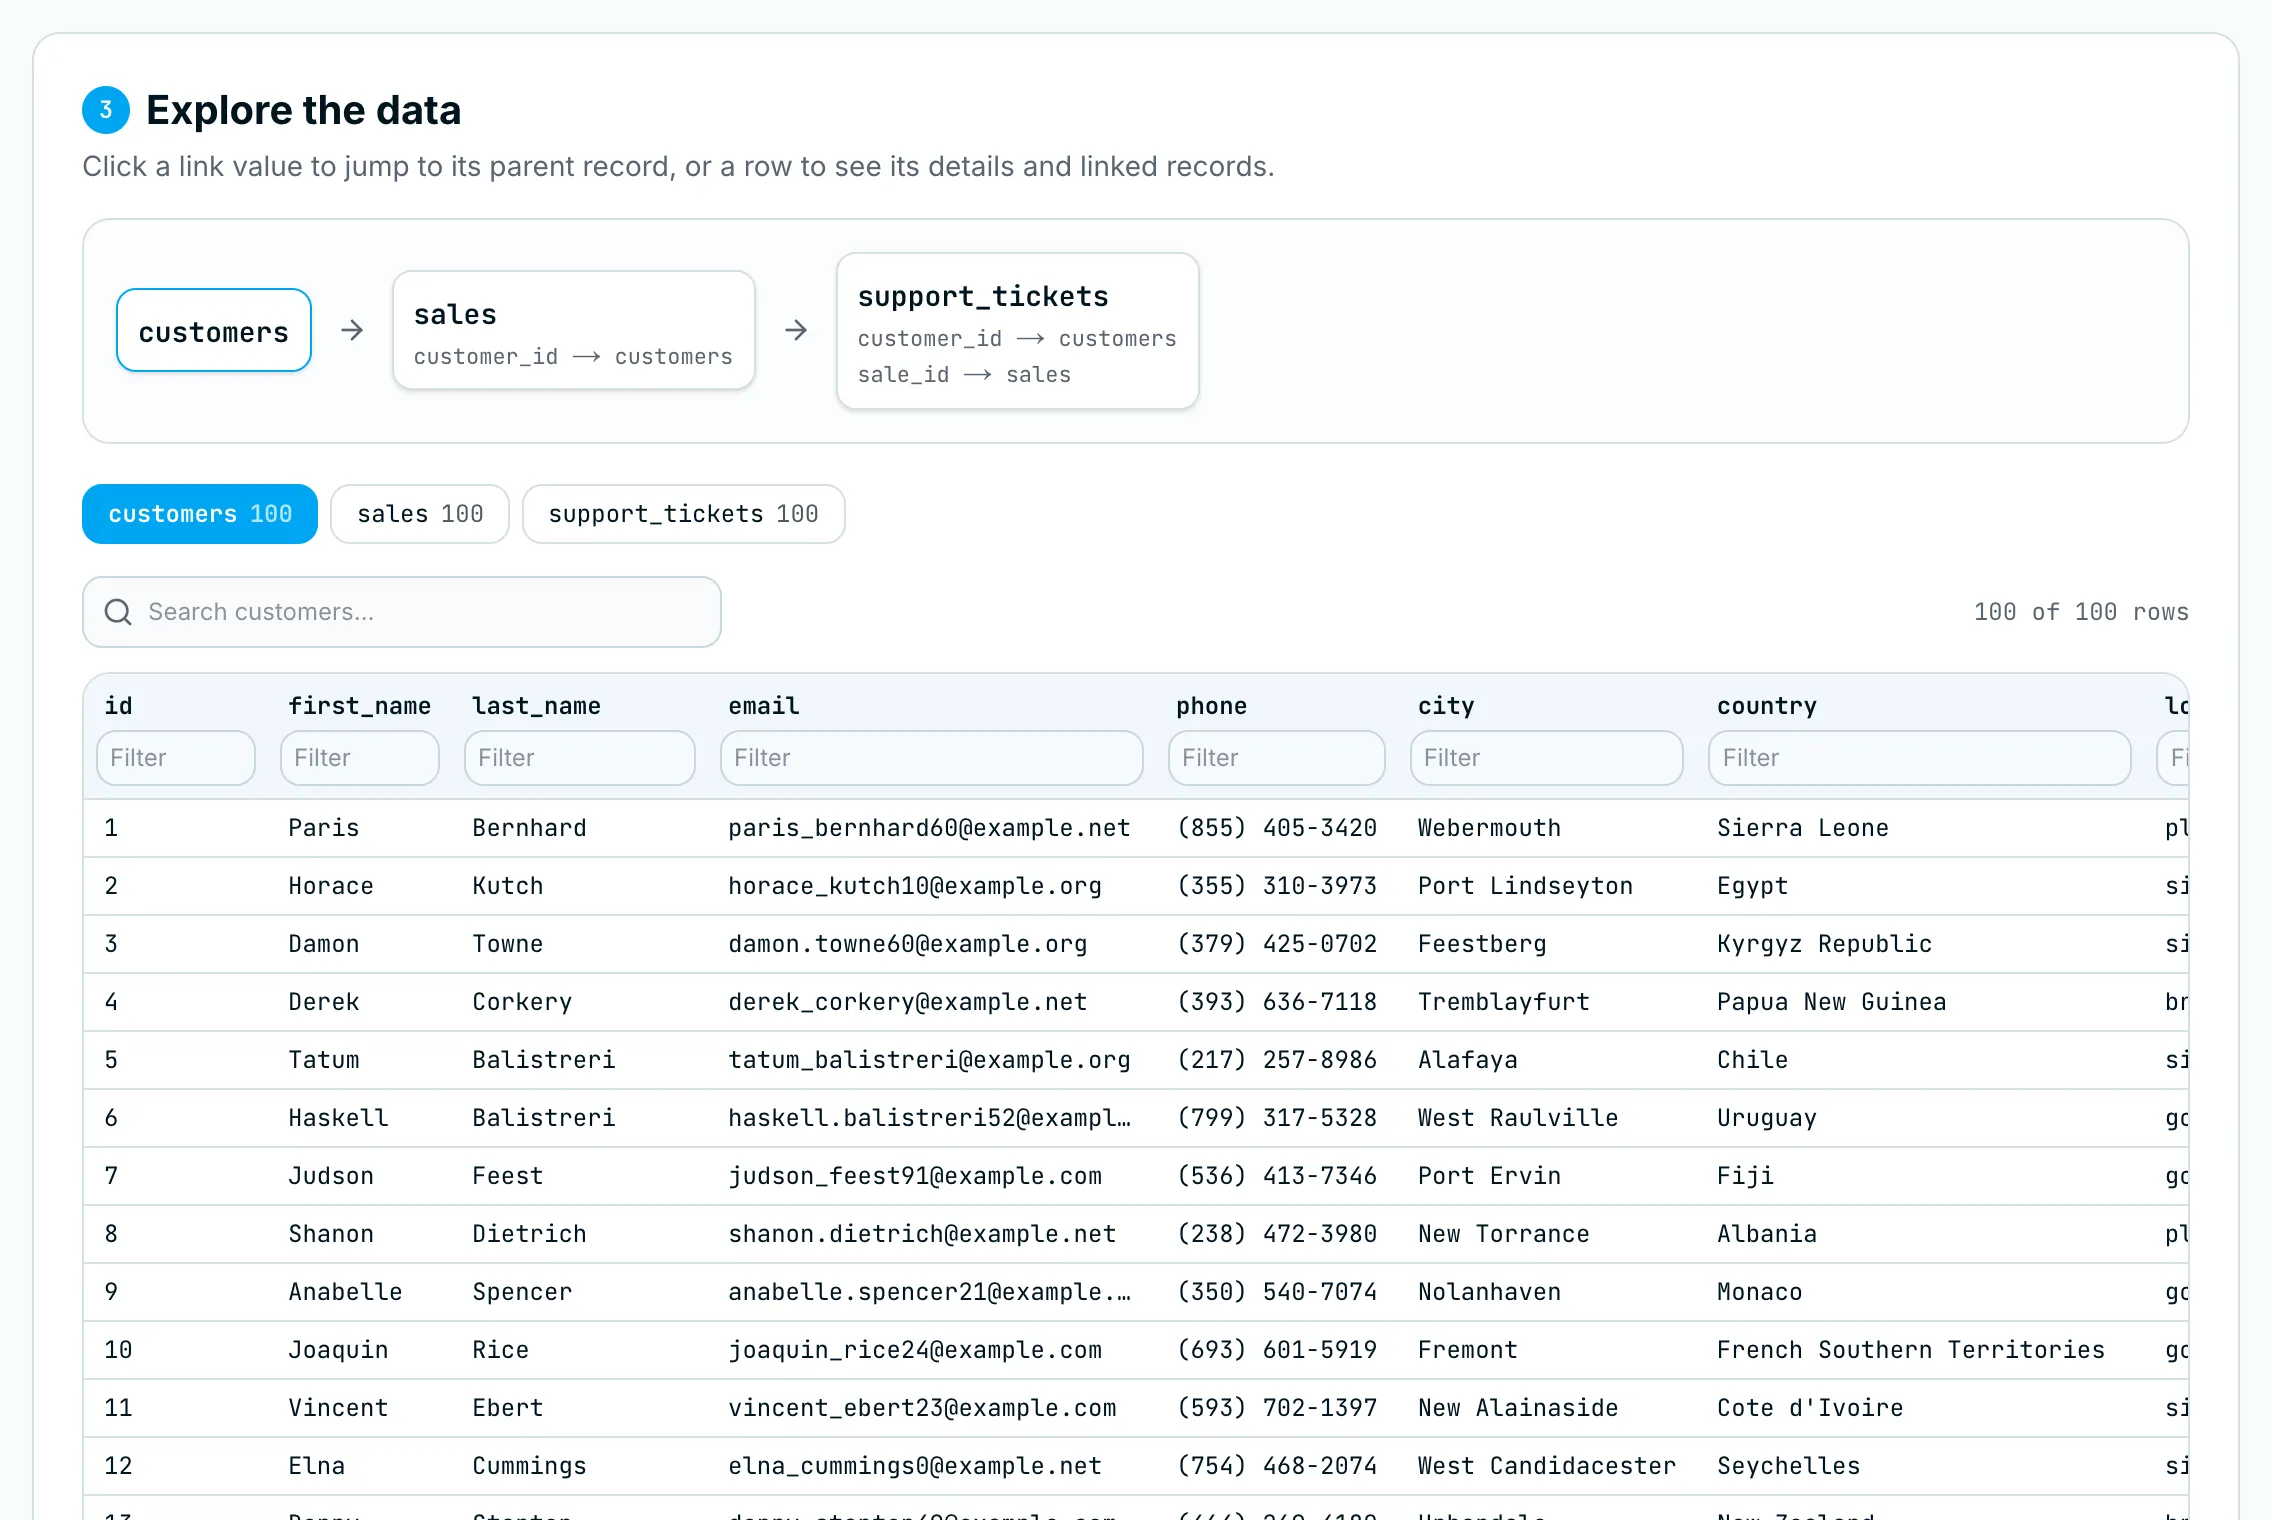
Find your way around
- Relationship map — tables laid out from parents to children, with the link columns listed under each child. Click a table to open it.
- Table tabs — one per table, with its row count. Each page shows 50 rows; use the arrows at the bottom to page through.
- Search — the search box looks across every column of the current table.
- Column filters — type in the box under a column header to keep rows that contain that text. Start with
=for an exact match, e.g.=42.
Active filters appear as pills above the table. Click a pill’s × to remove it, or Clear filters to remove them all.
Follow a link to its parent
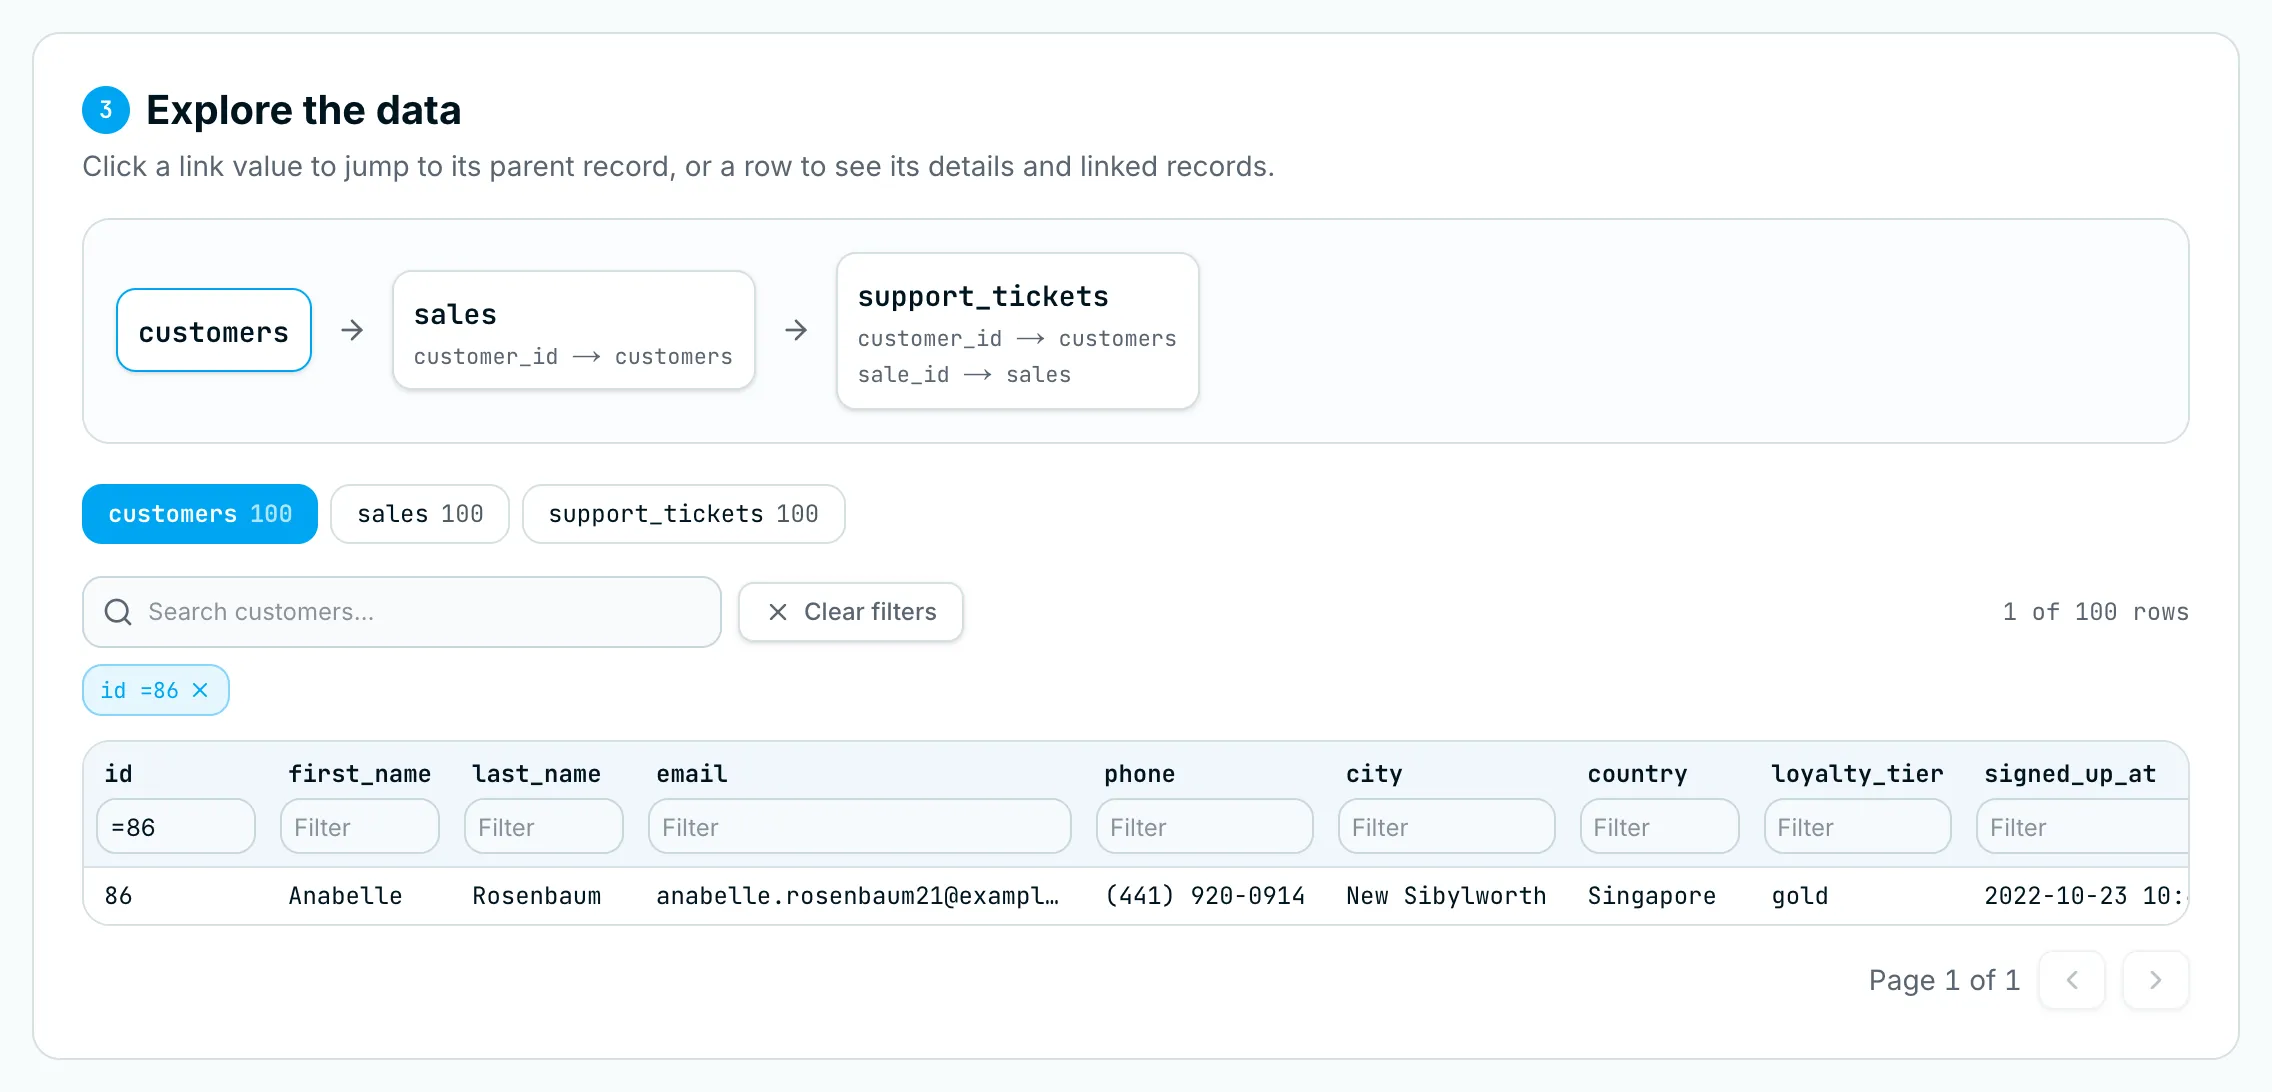
Values in link columns are shown as links. Click one to open the parent table, filtered to that exact record.
For example, clicking customer_id 86 on the sales tab opens customers filtered to id =86:
See a row’s details and linked records
Click any row to open its details panel on the right:
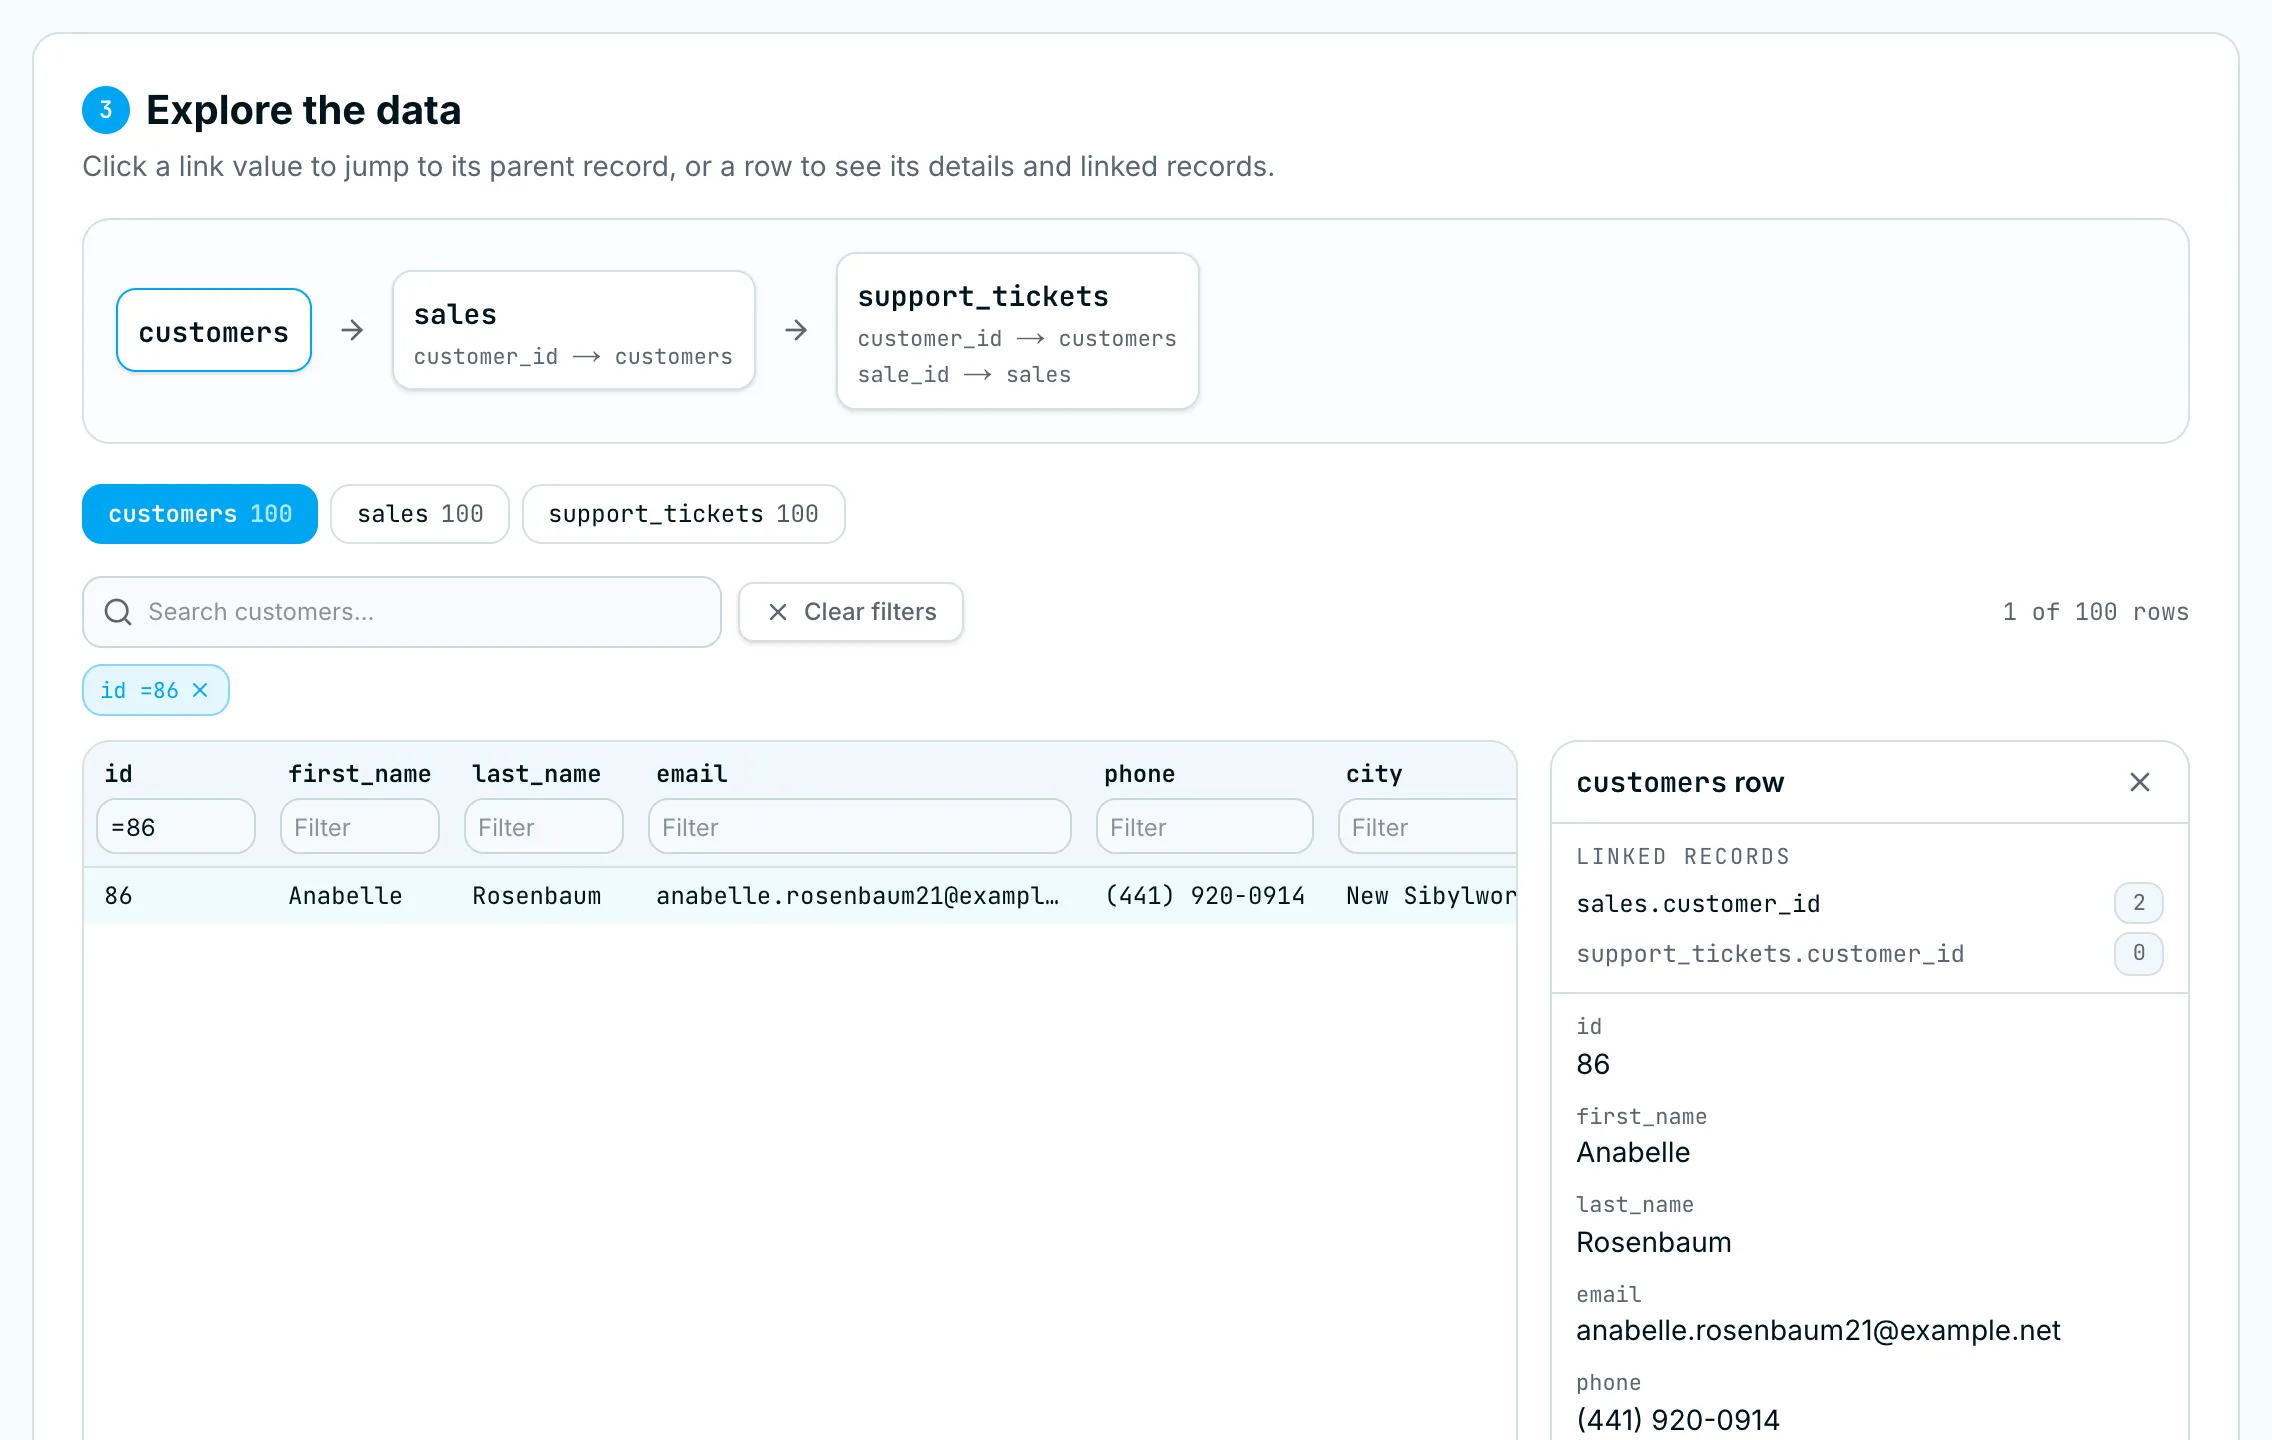
- Linked records shows how many rows in other tables point at this one. This customer has 2 sales and 0 support tickets. Click a count to jump to those rows.
- Below that, every field is shown in full, including long text that’s cut off in the table.
- PDF cells show as
[PDF 0.7 KB]in the table. Download the file from the details panel.